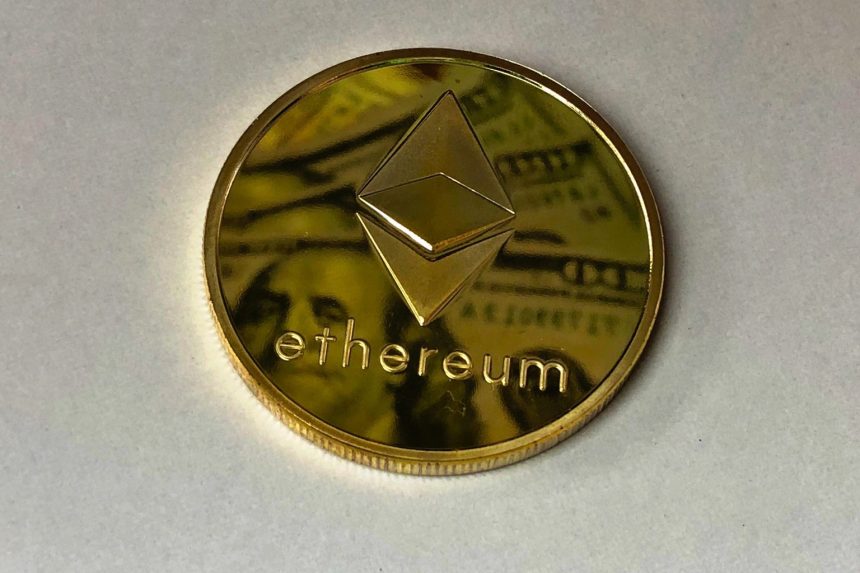
Ethereum energy use is a central metric after the network’s shift to proof-of-stake. Cambridge research reports the Merge reduced consumption by over 99.9%. New figures add detail on power demand, energy mix, and emissions. Analysts now place annual electricity needs in single-digit gigawatt-hours. A majority share appears to come from sustainable sources. However, methods and boundaries still shape interpretation.
Cambridge researchers concluded that the Merge cut electricity use by more than 99.9% versus proof-of-work. Their work shows a structural move from energy-intensive mining to validators. As a result, operational power requirements fell across core activities. Network energy and emissions profiles shifted almost overnight in September 2022. This remains a key baseline for comparisons.
In addition, a bottom-up infrastructural audit quantified current consumption at about 7.87 GWh per year. That translates to a continuous load near 0.90 MW as of mid-2026. The annual figure is said to be less than half the electricity used by the British Museum. The comparison highlights the scale-down from industrial mining to validator operations. It also frames today’s footprint in practical terms.
Meanwhile, the same audit estimated annual carbon emissions at roughly 2.37 ktCO₂e. This is comparable to the combined annual footprint of about 900 UK households. Therefore, emissions now reflect the energy mix behind validator infrastructure and related services. Assumptions about geographic distribution can shift totals. Regional power markets matter for intensity.
According to the audit, approximately 56.4% of electricity consumption comes from sustainable sources. Of that share, 39.4% is renewables and 17.0% is nuclear power. This exceeds the reported global average of roughly 43% sustainable energy. As a result, the energy mix appears cleaner than the broader grid baseline. The methodology informs how that share is assigned.
However, sourcing estimates depend on provider disclosures and regional data. Results can vary across datasets and allocation methods. Off-chain services and tooling may not be uniformly included. The bottom-up approach maps components directly, yet scope choices remain consequential. Clear boundaries help comparisons across studies.
Cambridge’s core finding remains that the Merge led to a dramatic reduction in demand. The new figures show how that shift plays out in daily load and intensity. The pre-Merge era linked security to escalating hardware and energy inputs. Now, validator participation relies far less on physical resource use. This underpins a leaner operational profile.
In practical terms, a sub-megawatt continuous load is a notable change. Scaling debates now focus on software efficiency and data availability. Emissions progress links to where validators source power. Policy and market structures can be decisive for that mix. Location decisions influence results over time.
The reported sustainable share indicates progress versus the global average. Independent replication could adjust the percentages as data updates. On-chain activity and client diversity may shape infrastructure choices. Operators and providers can alter footprints through colocation and procurement. These levers interact with regional grids.
Contextual comparisons with institutions or households are illustrative. Readers should consider uncertainties around boundaries and life-cycle assumptions. Still, the scale change since the Merge is consistently supported by Cambridge’s analysis. The audit’s numbers offer a current snapshot that complements those findings. Periodic reviews can refine the picture.
Key takeaways include sharp declines in total energy, lower carbon intensity, and a majority-sustainable mix. Method transparency and re-measurement remain essential for credibility. Continued audits and open datasets can track sourcing shifts. Over time, a clearer view of Ethereum energy use should emerge as data quality improves. This supports informed discussion.
Ethereum energy use after the Merge
Cambridge research attributes the 99.9%+ reduction to proof-of-stake’s lower resource needs. The audit’s 7.87 GWh annual estimate and 0.90 MW continuous load illustrate that change. The 2.37 ktCO₂e figure contextualizes post-Merge environmental impact. Variations in grid carbon intensity can move these totals. Scope definitions also matter.
Energy mix and sustainability share
The audit’s reported 56.4% sustainable share, including 39.4% renewables and 17.0% nuclear, exceeds the ~43% global average. Therefore, Ethereum’s sourcing appears relatively cleaner, given the stated method. Shifts in validator geography could influence future mixes. As data updates, measured Ethereum energy use may be revised. Replication can validate trends.
- Electricity use: ~7.87 GWh/year; ~0.90 MW continuous
- Emissions: ~2.37 ktCO₂e annually
- Sustainable share: ~56.4% (39.4% renewables; 17.0% nuclear)
According to the source, the Merge’s impact on power demand is well established. The audit’s bottom-up approach supplies recent granularity on load and emissions. Readers should account for methodological nuances when comparing studies. In the interim, Ethereum energy use stays far below its pre-Merge baseline. See Cambridge coverage here: crypto.news report.